
5 Charts to Navigate This Chaotic Market
I have 5 charts for you today which put this crazy market into context and give some clarity on what might come next.
We’re at a fascinating crossroads for markets, geopolitics, and finance.
Let’s get started.
Semis Party Like It’s 1999
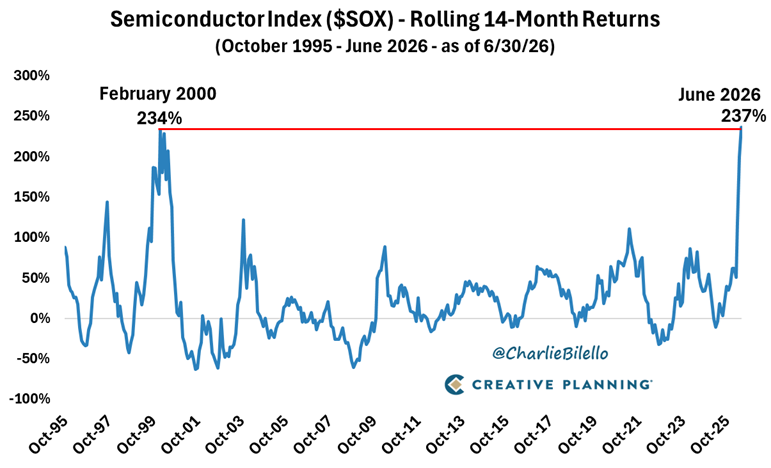
First up, semiconductor returns. The index below includes U.S. semi stocks like Nvidia, Micron, Intel, Broadcom, Marvell, Texas Instruments, and more:
 Source: Charlie Bilello
As you can see, during the dotcom bubble, semiconductor stocks soared 234% over 14 months in the period leading up to February 2000. That was the peak of the market, and tech stocks wouldn’t recover for about 15 years.
And in the past 14 months, SOX is up 237%. Reminiscent of the dotcom days.
Maybe this time is different, and yes, the stocks are more profitable today. But it’s undeniable that markets are getting bubbly. Semis are looking especially frothy. When AI spending inevitably slows down, watch out below…
+$2.99 Trillion
Over the past year, America’s federal debt jumped by $2.99 trillion.
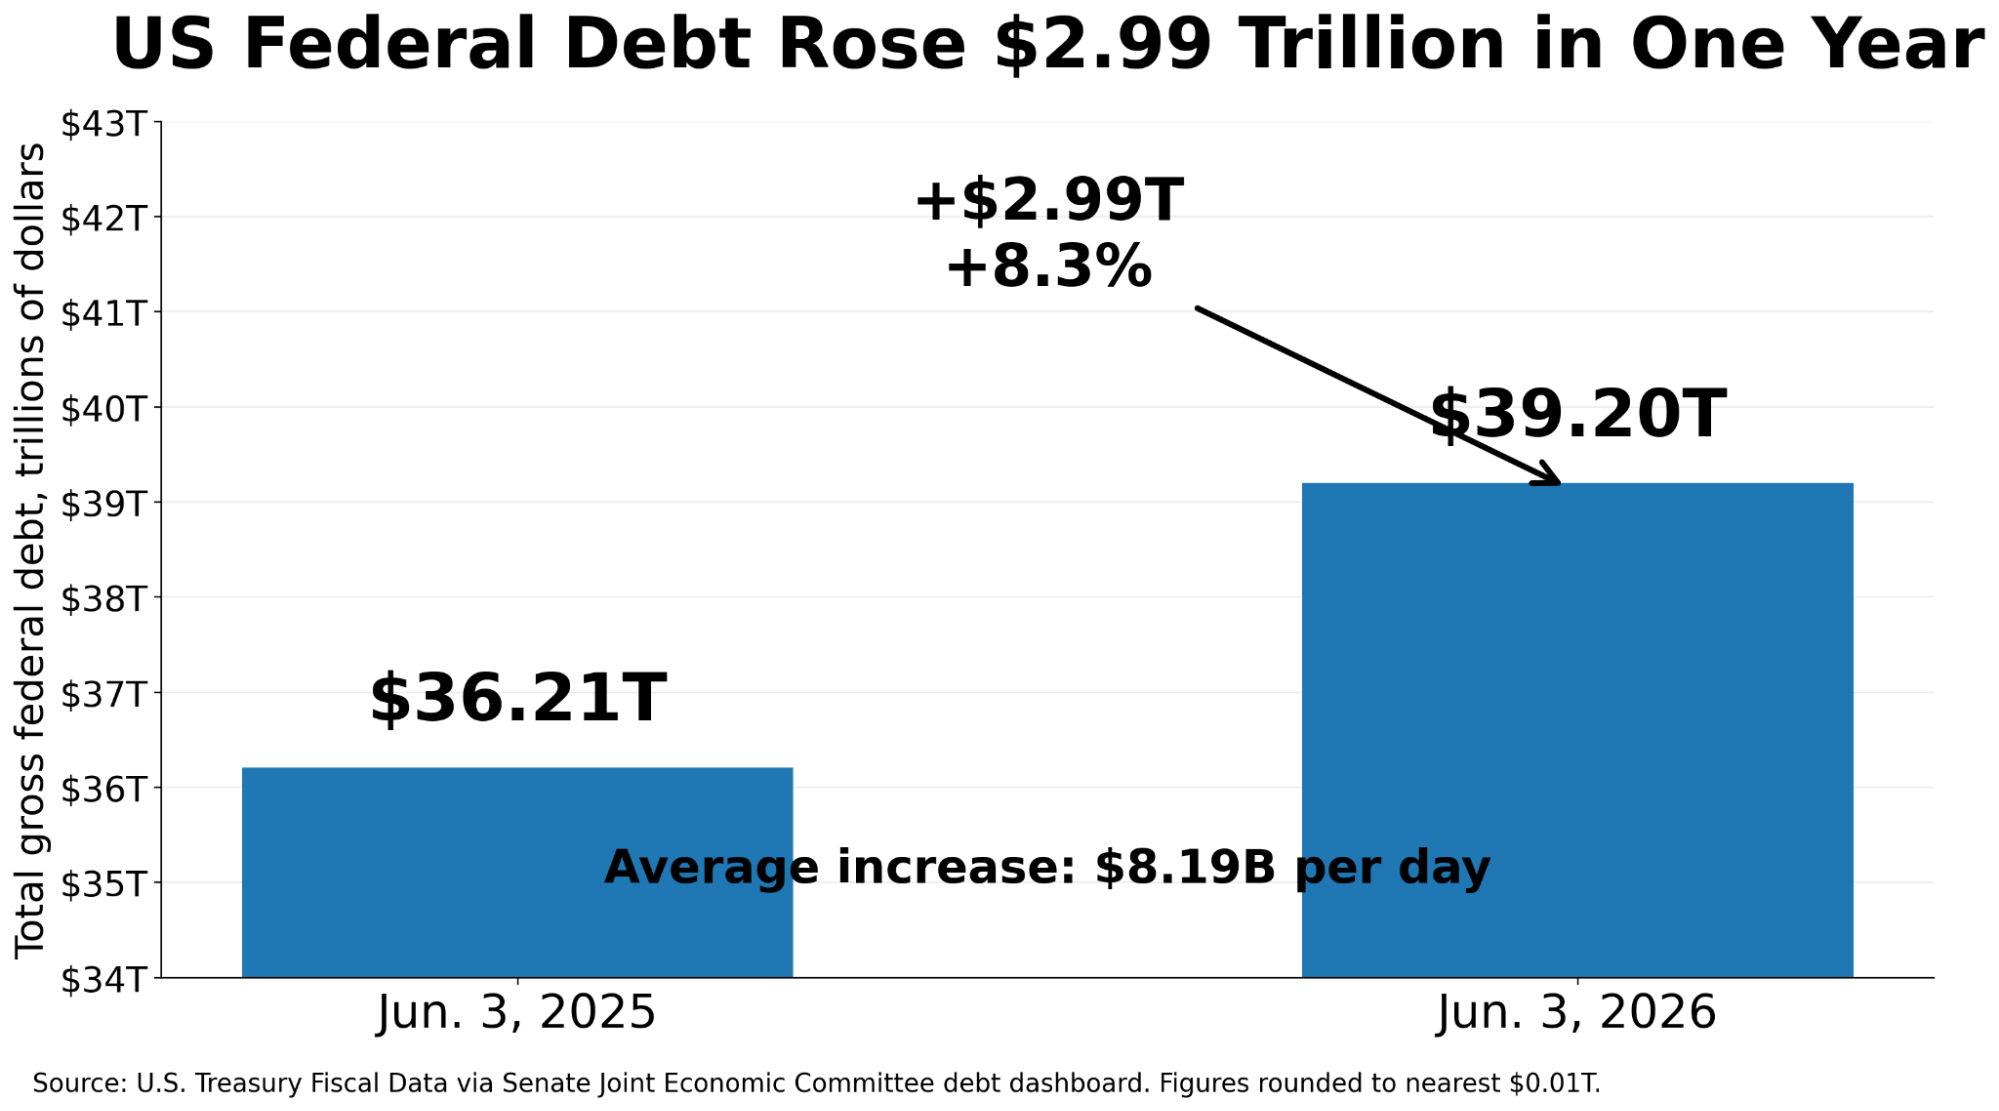
Needless to say, our current trajectory is unsustainable. We’re paying about $1.2 trillion per year just in interest on federal government debt.
This is the key reason I believe interest rates will need to go down to near zero sometime in the next few years. Even if inflation remains above target. And it’s why I still believe holding precious metal investments is key to wealth preservation and growth.
AI Infrastructure Surpasses Humans
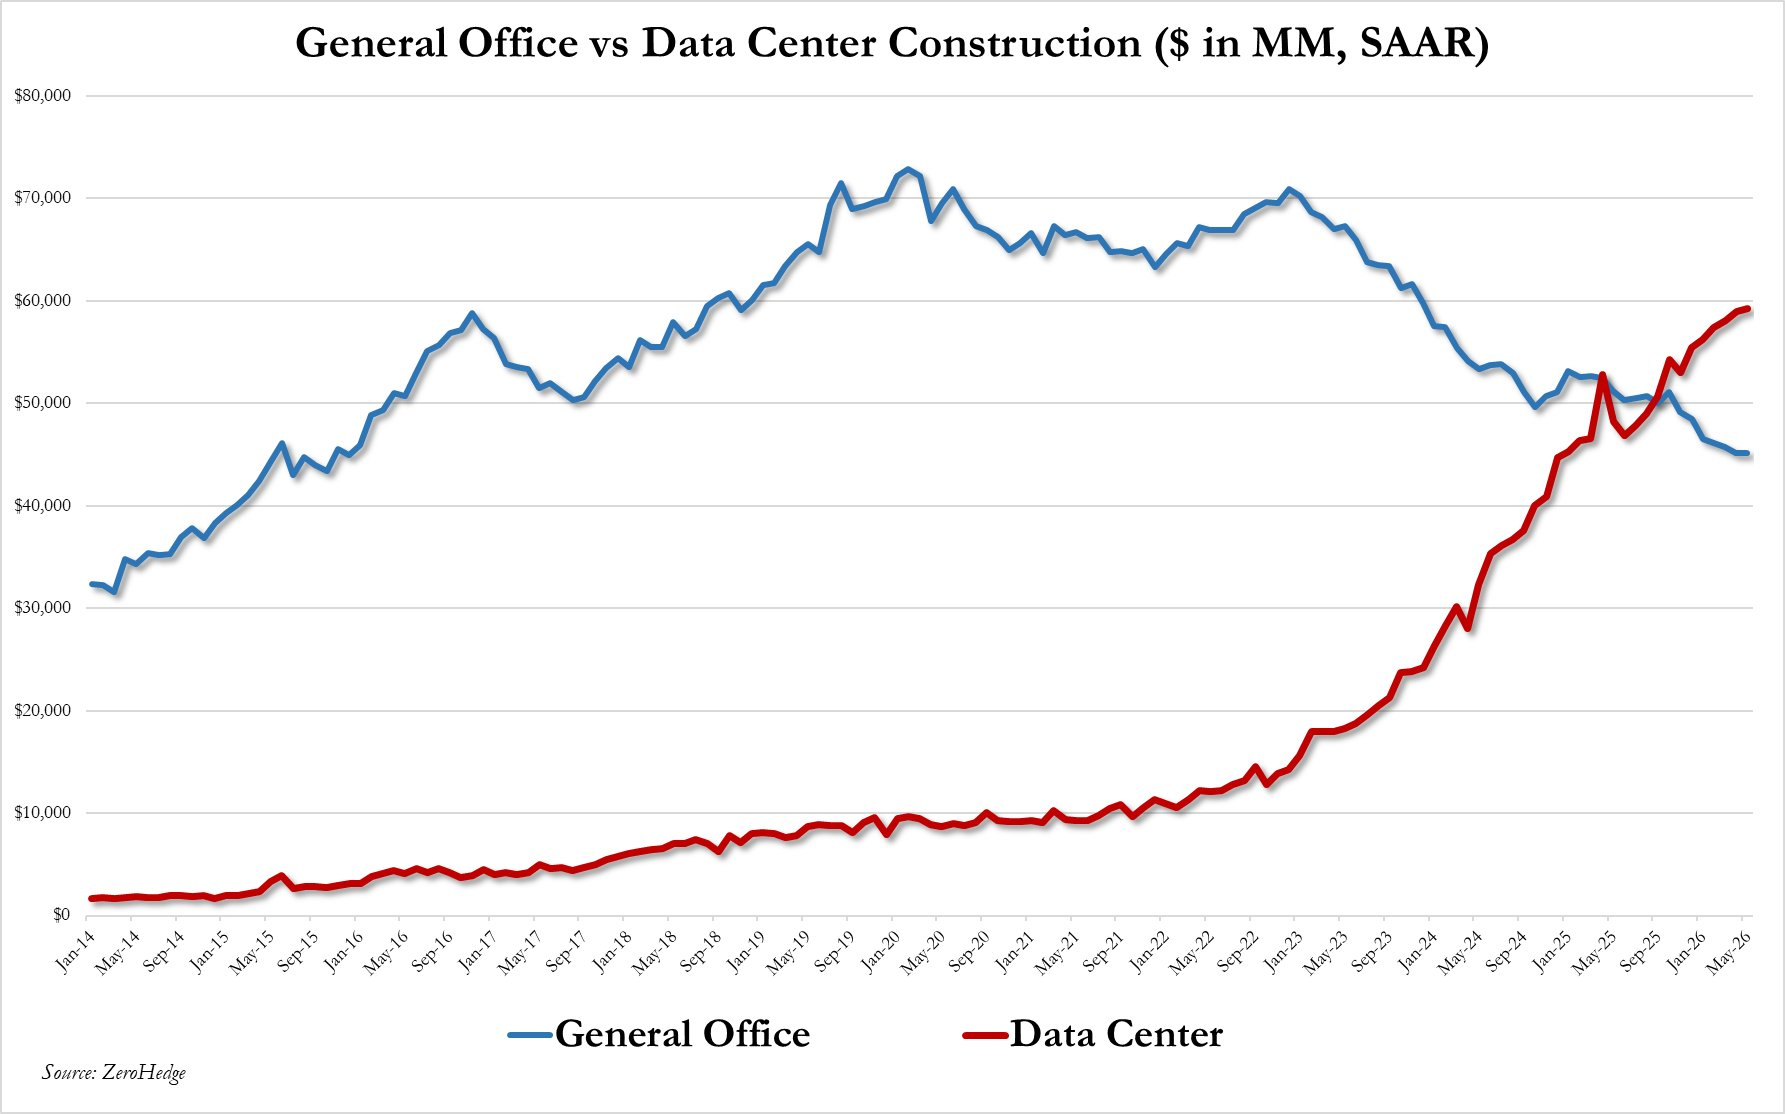
We all know data centers are booming. But the chart below puts it all into perspective. It compares office construction (blue) to data centers (red):
 Source: Zerohedge
Simply remarkable. We’re spending more on infrastructure for AI than humans.
And since 2016, spending on data centers is up more than 10x.
But all around the country, locals are pushing back against big tech. Data centers are extremely loud. They spike local electricity prices to unaffordable levels. In some cases, they pollute the water with nitrites and other chemicals.
And most importantly, our power grid is hitting its limits. We can’t build new power plants fast enough to keep up. So eventually, the data center boom will have to slow down significantly. And that will likely mark the top of this boom/bubble.
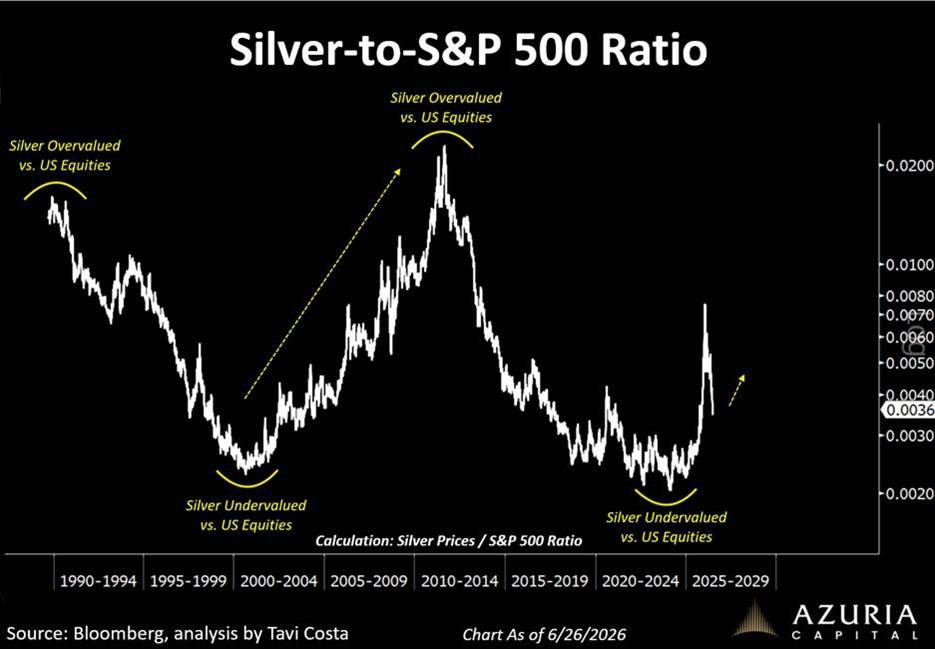
Silver vs Stocks
Silver has had a rough few months. After rising almost 4x in a year, it has been cut in half.
The chart below compares silver to the S&P 500. As this chart rises, silver is beating stocks. When it falls, it is losing.
 Source: Tavi Costa
As you can see, even at the recent highs we didn’t get anywhere near the levels we saw in 2011, when silver outperformed stocks for an extended period.
We’ve gotten our big correction, and I believe the next 5 years will be excellent for silver. It still has a long way to go to reach 2011 levels (compared to stocks). And supply deficits today are far more extreme than they ever were back then. Solar is booming and investment demand is soaring, especially in Asia.
I remain convinced silver will find new highs over the next few years. Maybe sooner.
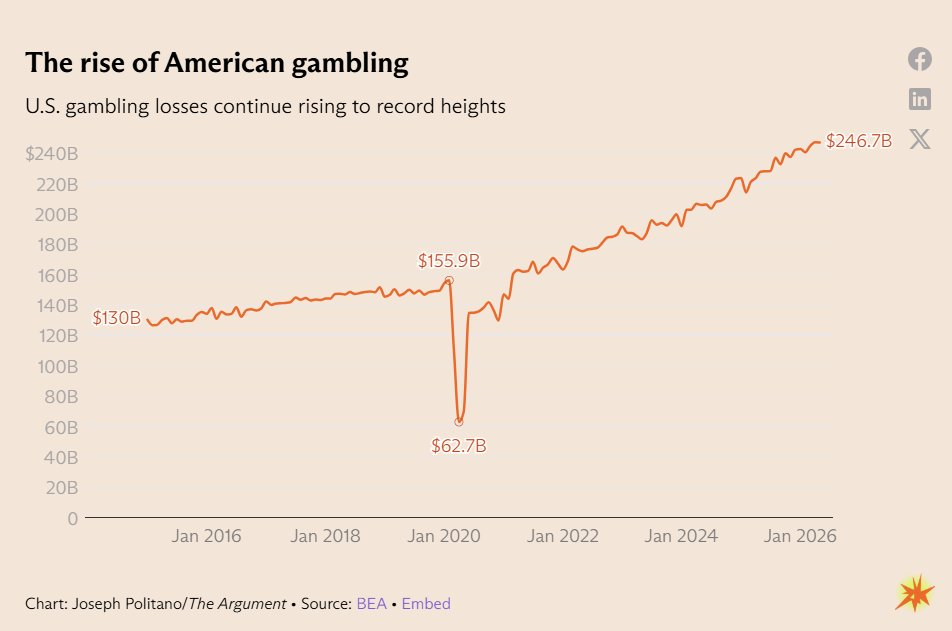
-$246B Gambling Losses
The USA’s gambling problem is getting worse. As a whole, Americans are on track to lose $246 billion this year.
 Source: Joey Politano
As we highlighted last week, Americans invest about $600 billion in 401ks every year. That number could be $850 billion if we ever learn that gambling has horrible odds.
Look, if you can afford to gamble and enjoy it, great. But many people are trying to strike it rich. And that almost never happens.
Gambling is all around us, and we should be on guard against its pernicious effects. Saving and investing should always come first.
I hope you all have a nice Independence Day weekend.

Comments: