Nvidia Earnings: Buy, Sell, or Hold?
I’ve been thinking about throwing my laptop out the window and sailing away to a deserted island this week to skip the NVDA earnings circus.
That’s probably not a practical idea. I can try to run — but there’s no way to avoid the most popular tech stock on the market revealing exactly how much the AI boom has grown over the past three months.
It’s going to be another noisy week as the three-ring financial media kicks off wall-to-wall NVDA earnings coverage — the greatest show on Wall Street. Step right up to witness AI chip madness! Revel in the aftermarket reaction! Listen to the amazing conference call!
Unfortunately, there’s no cotton candy (unless you make your own). But CNBC will gladly treat you to plenty of performative hype surrounding the earnings event of the year.
We might as well embrace the chaos.
It’s already been a wild month. Just a few weeks ago, we were watching the market fall apart and the VIX spike to levels not seen since the Covid crash. Investors panicked and started selling. But then the selling stopped almost as suddenly as it began — and stocks ripped higher for two straight weeks.
If that wasn’t enough excitement, Jerome Powell stepped up to the mic in Jackson Hole on Friday and promised rate cuts in September. The good times rolled right into the afternoon as the averages went out near their weekly highs — and less than 1% from all-time highs set a little more than a month ago.
In the span of just a couple of weeks, we went from the end of the world to the beginning of the next great bull run, spinning the heads of just about every trader on the planet.
If this incredible recovery felt unusually fast, you’re absolutely correct. My friend Michael Batnick over at Ritholtz Wealth ran the numbers, and it turns out that the Nasdaq takes 32 days on average to rally 10% after falling into correction territory. This time around, it took only eight. As Michael notes, this is the fastest 10% rally ever following a corrective move.
The bulls are back in town — and we need to adjust to this lightning-fast recovery as the final week of summer trading looms large.
Update: “The Dip” Strikes Back!
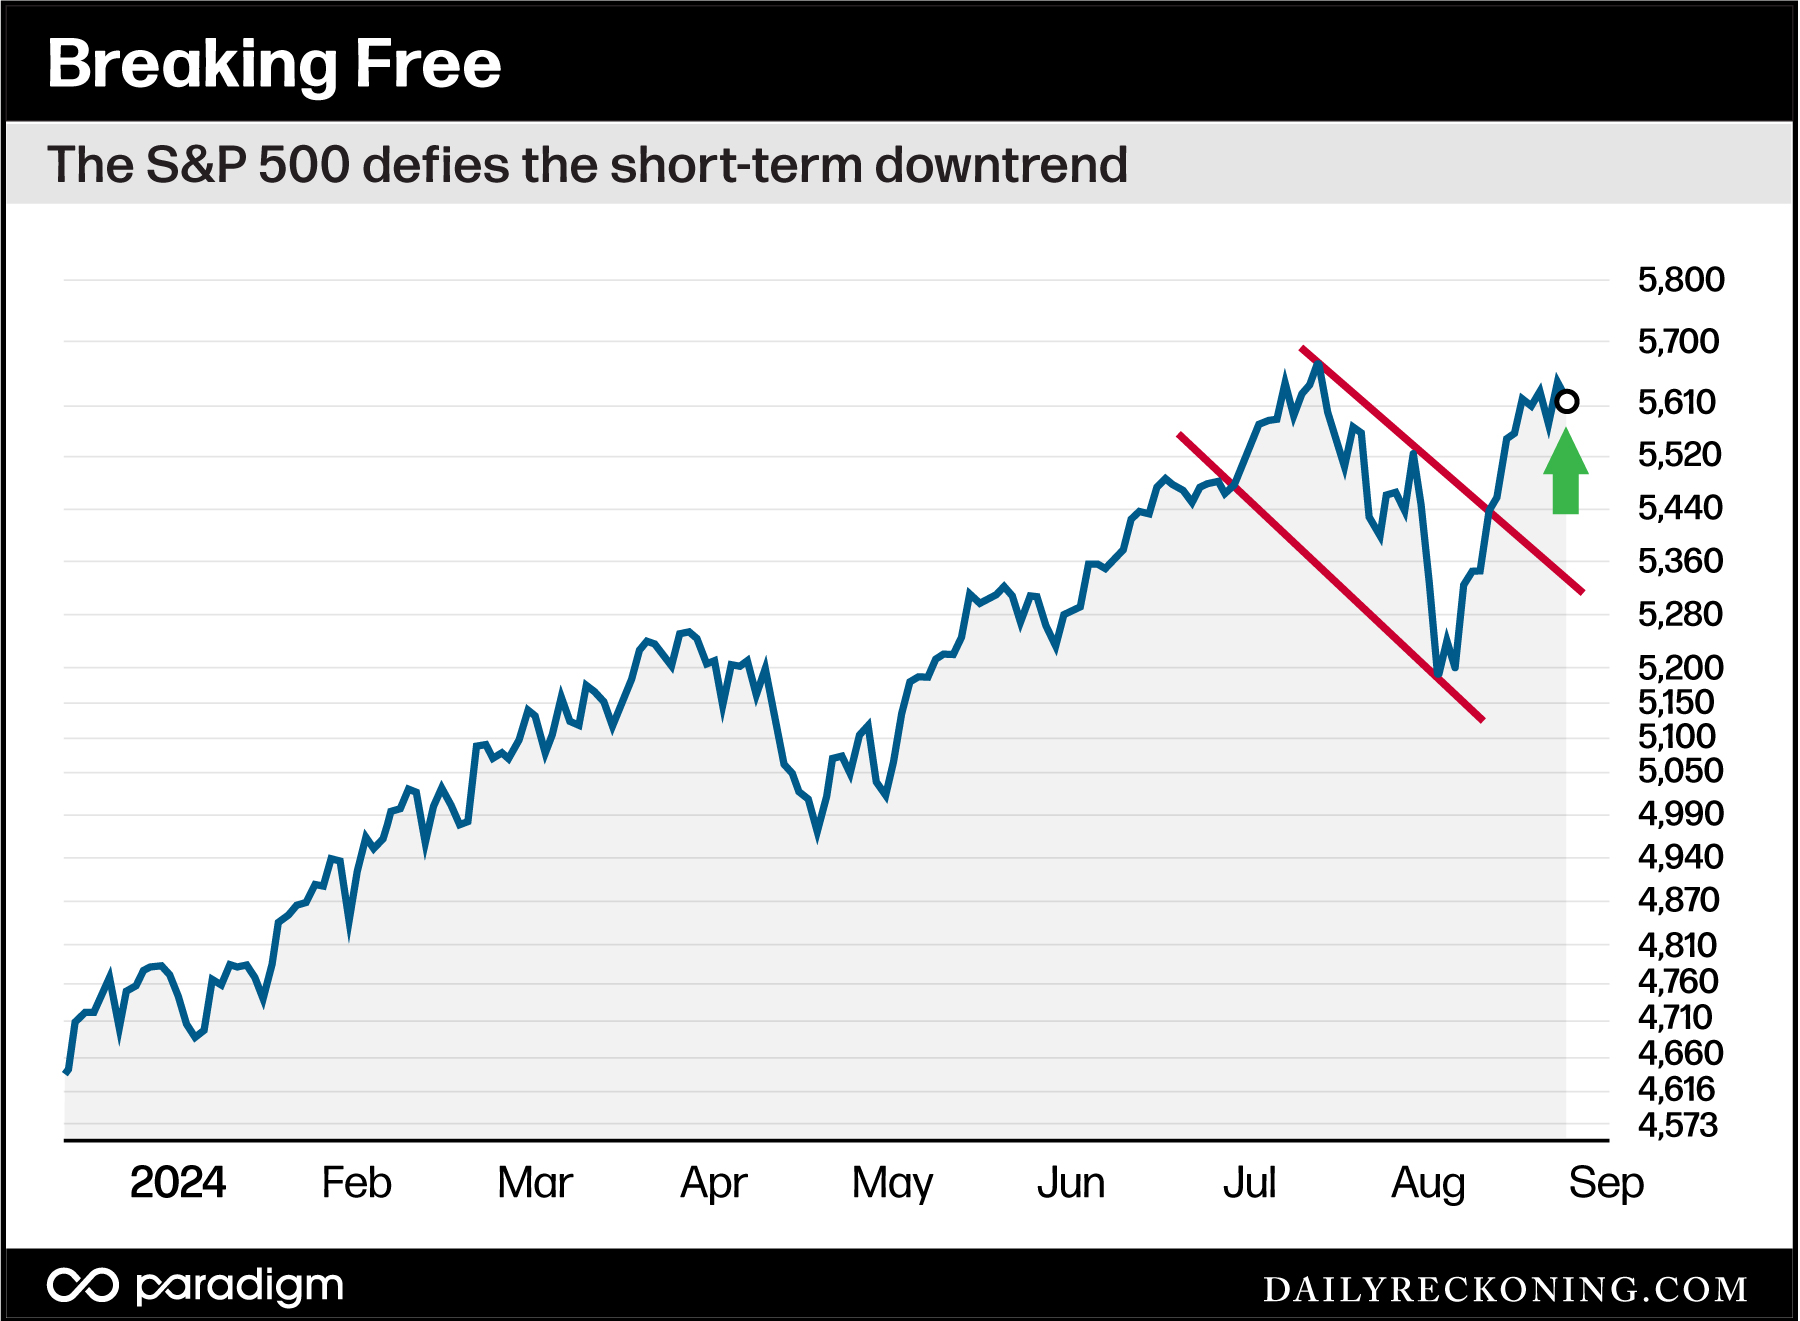
Two weeks ago, I highlighted the S&P 500’s short-term downtrend and the idea that it would need to close the Aug. 2 gap and extend to approximately 5,450 to break out of its funk.
If a sharp rally does materialize here, I noted, plenty of buyers should gobble up shares and shove the markets back to all-time highs.
To be clear, I didn’t expect it to happen so fast! I figured a retest of the Yen panic lows was probably in our future. The 200-day moving average near the April swing lows at 5,000 looked like a reasonable landing area, which matched up well with the bottom of our downtrending channel.
As we now know, the market wasn’t as vulnerable as it appeared. Instead of choppy, volatile conditions, we were treated to a near-perfect “V-recovery” that effectively erased the early August drop in just two short weeks.

Assuming we’re out of the weeds for now, here’s our unofficial drawdown tally:
The VanEck Semiconductor ETF (SMH) fell almost 30% from its July highs. The Nasdaq 100 dropped 15%. The S&P 500 fell nearly 10%. And the Magnificent Seven stocks — measured by the Roundhill Magnificent Seven ETF (MAGS) — dropped 22%.
Despite the sheer speed of the recovery, we could argue that these drawdowns were all deep enough to induce plenty of anxiety amongst the “stocks only go up” crowd. They also offered significant momentum resets that can potentially set up the next big move higher.
But right now, I’m much more interested in what certain groups aren’t doing while the averages inch closer to their respective all-time highs…
A Magnificent Letdown
During the fastest snapback in history, one might expect the mega-cap leaders to retake control of the market.
But that hasn’t been the case.
In fact, the Mag 7 stocks have trailed the broader S&P 500 so far this quarter, according to BMO’s Brian Belski, via MarketWatch, who notes the mega-cap kings are set to underperform the index for the first quarter in almost two years.
For the record, this data is nearly a week old. But we continue to see this trend playing out as NVDA’s earnings creep closer. Semiconductors failed to gain traction on Monday as the VanEck Semiconductor ETF (SMH) finished the day down more than 2.3%, compared to a drop of just 0.3% in the S&P.
While its comeback off the August panic lows was impressive, SMH would need to rally more than 16% from Monday’s close to top its July highs (Remember, the S&P is now less than 1% from its all-time highs).
It’s the same story for the Mag 7 names. Yes, they’ve rallied off their respective lows. But the Roundhill Magnificent Seven ETF (MAGS) still needs to run up another 11% before challenging its August highs.
For the record, I don’t believe this semiconductor/Mag 7 underperformance is tipping NVDA’s hand. In fact, it will probably have no bearing at all on the earnings reaction we’ll witness tomorrow afternoon. On the flip side, I also don’t think the market’s short-term performance will live or die by NVDA’s results.
But I do think we’re seeing the resurgence of that pesky rotation trade we’ve discussed this summer. While mega-caps and semis are underperforming, the rate-sensitive names are popping higher, including tech-growth names, small-caps, and biotechs.
The Yen panic acted as a hard reset for this rotation theme. But these stocks are now roaring back to life as September approaches. The best part? You don’t have to make any wild bets on NVDA earnings to make a buck off these trends.
Instead, bet on these rotation trades remaining in play as the bulls continue to pile back into the market leading up to the September cut.


Comments: