
FX Markets: The Key to Predicting Moves in the Gold Price
In 1914 gold was money.
Money wasn’t debt or credit back then. It was simply gold, and banks created credit on top of their gold reserve base. They couldn’t go crazy in the credit creation process, because there was only so much gold in the world and its supply grew at around 2%.
Plus, gold (not debt) was a form of international payment, so once again debt growth didn’t get too excessive. If you ran a trade deficit, your creditors demanded payment in gold to settle the debt. If you ran out of gold, interest rates would rise (to discourage consumption and encourage saving) and the trade deficit would slowly swing back to surplus.
That’s roughly how the gold standard kept things in balance. But in 1922 that all changed…
It set the world on a path to where we are today. Where money and debt and credit are all interchangeable terms. Where debt must keep rising to keep the system going. And where it will increase to such a point that it will collapse back on itself.
Most people think the world’s monetary architecture changed for the worse in 1971 when Nixon severed the US dollar’s link to gold. But actually, a little known event in 1922 set the global monetary system on its present day course.
Meanwhile, we’ve sneaked a look at Marc Faber’s presentation at this year’s World War D conference in Melbourne, Australia, and his basic premise is that the system is now on its last legs. It should be an interesting few days.
On the topic of money, the Wall Street Journal reports that profit growth slowed at China’s big banks in 2013. Industrial and Commercial Bank of China grew profits by 10%, the slowest pace since listing in 2006. Bank of China’s profits grew 12%, the second slowest pace of growth since listing in 2006. And Agricultural Bank of China posted a robust 15% profit rise, but was still the slowest pace of growth since listing in 2010.
China’s big banks make state sanctioned profits. Although the rules have loosened a little recently, for years financial repression saw the big banks make a chunky 3% spread on lending. That is, depositors received 3% interest while borrowing costs were 6%. The difference was the banks’ to keep.
As the chart below shows, since 2009 bank loan growth in China has been huge. Although it’s slowing marginally, it’s still running at a healthy clip of just under 15%. Most of the recent slowdown has come from the ‘shadow banking’ sector, which is included in the ‘total credit’ growth rate in the chart.

But the problem for China’s banks is that some of the loans they made during the boom are coming back to bite them…
Bad loans are on the rise and as the credit bubble deflates, banks will have to write off past profits. Expect more of that in the next few years. The market certainly does, which is why China’s banks look ‘cheap’.
So, whatever happened to good old ‘money’? Gold, once the anchor of the global financial system, is now nothing more than flotsam in a sea of debt. Last night it fell another few dollars, and is now about $100 dollars an ounce lower than it was 10 days ago. So much for gold’s recovery!
Gold is a mere shadow of its former self. Trading in the gold market is now dominated by paper forms (derivatives) of the metal. Physical trading makes up a very small portion of the overall market.
When a financial system goes from sound to unsound, it creates more claims on real assets than there are real assets in existence. So the system creates paper assets to absorb the constant supply of new money/credit/debt. Hence the explosion of the derivatives market in recent decades.
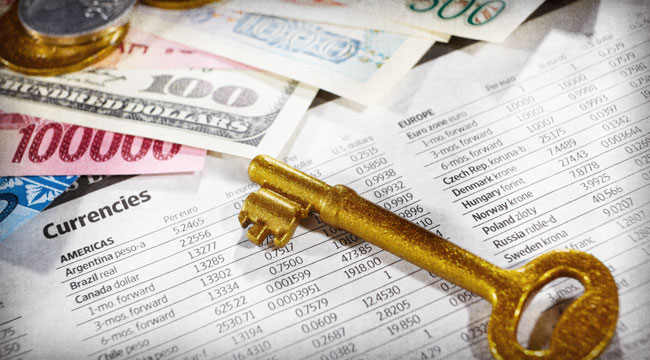
Most investors don’t own real assets; they simply have ‘exposure’ to them via the derivatives market. Or in the case of gold, which also forms the role of alternative currency, the derivatives (or paper forms of it) extend to the currency markets. Back in the 1970s gold received a currency symbol, XAU, which made it available for trading in the foreign exchange (FX) markets.
FX markets are huge. They are the largest markets in the world by volume. Back in 2011 the London Bullion Market Association (LBMA) released a trading survey showing that daily clearing in the gold market was the equivalent of 5,400 tonnes, or around US$240 billion at the time.
Last year, we sent the LBMA an email asking whether gold trading as an FX currency was behind the huge volumes. We recently got the following response:
‘The Survey included all forms of gold trading so certainly included gold currency trading which would have contributed to the significant numbers that came out of the Survey.’
So most of the ‘gold’ trading that takes place occurs in the FX markets and has nothing to do with physical gold. No wonder it’s turned into a volatile beast. The proper price signals that poor old physical gold used to give off, warning about system excesses, have been well and truly muffled.
Regards,
Greg Canavan
for The Daily Reckoning
Ed. Note: In Greg’s presentation at the World War D conference in Melbourne, Australia, he explains in detail why the system cannot continue to muffle gold for much longer, what that means for future gold prices, and how investors can use it to their advantage. And even if you couldn’t make the trek to Melbourne, The Daily Reckoning’s managing editor was live on the scene, so readers still get a front row seat to the whole thing. To gain access to this and other great benefits, sign up for the FREE Daily Reckoning email edition, right here.

Comments: