Just How BIG Is This Bubble?
Never before have so many… owed so much… to so few.
We refer not to Mr. Churchill’s hosannas to the Royal Air Force — concerning 1940’s Battle of Britain.
We refer instead to the 2024 Battle of Bulls and Bears… to the stock market.
Never have so many investors owed so much of their money to so few stocks.
That is because a mere spoonful of stocks are hauling stocks to record heights.
These stocks are: Nvidia. Alphabet. Amazon. Apple. Meta. Microsoft. And Tesla — collectively, the “Magnificent Seven.”
These sweethearts boast a combined market capitalization of $12 trillion.
That is the combined market capitalization of the next 42 leaders of the S&P 500.
That is, a mere seven stocks haul the equal load of the next 42.
Investors have piled into them and fattened upon them.
Investors have also inflated a gorgeous bubble.
Bubble: “a good or fortunate situation that is isolated from reality or unlikely to last.”
Precisely how gorgeous is this bubble?
Mr. Torsten Slok, chief economist for Apollo:
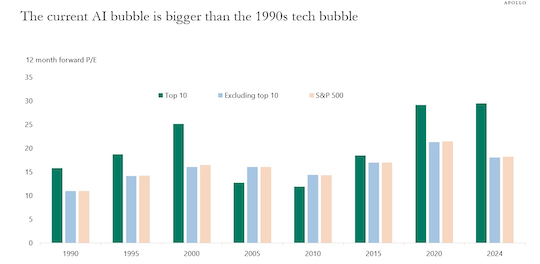
The top 10 companies in the S&P 500 today are more overvalued than the top 10 companies were during the tech bubble in the mid-1990s.
Kind heaven — can it be?
Recall: The 1990s technology boom shamed all others. Yet today’s leading wagon-pullers exceed the valuations of the technology boom’s leading wagon-pullers.
Thus we stagger. Thus we reel.
Thus we collapse upon the floor… in a heap… dizzied beyond all description.
Here is the picture that talks its thousand words:

Source: Apollo
In reminder: A low price-earnings ratio indicates stocks are bargains. A high price-earnings ratio indicates stocks are snares.
A price-earnings ratio of 17 is approximately par — as history runs.
What is Nvidia’s present price-earnings ratio?
It is not stratospheric. It is not even galactic.
It is instead a cosmic… 186.
186!
That is, investors in this magnificento are offering to ladle out $186 for each $1 of earnings.
In all, the seven magnificent stocks — the market’s wagon-pullers — post a price-earnings ratio of 50.
Meantime, the price-earnings ratio of the S&P 500… as a whole… runs presently to 27.
Thus the market is fabulously “top heavy.” A top heavy market is a lopsided market.
And a lopsided market is a vulnerable market.
Far too many chicken eggs bunch in one lone basket.
Shall we consider Mr. Robert Shiller and his famous CAPE ratio?
We will spare you CAPE’s inner wizardry. Know merely that it is a valuation metric. It is a more exotic and nuanced price-earnings ratio.
Its historic average — stretching to 1871 — comes in at 17.
CAPE scaled 31 in July 1929… 44 in November 1999… 38 in July 2021.
What does CAPE presently register?
Thirty-four. That is, the third-highest ratio on record. It exceeds even July 1929’s.
That is, the stock market is luxuriantly “out of whack.”
And that which is out of whack falls ultimately into whack.
We are therefore in for what mathematical men term “regression to the mean.”
When the S&P 500 regresses to its historical mean, we do not pretend to know.
The answer — as always — is on the knees of the gods.
Yet as the great Buddha never ever said: “The cost of every pleasure is the pain that succeeds it.”
We hazard investors are in for one mighty migraine…


Comments: