Waiting for Godot’s Crash
In Beckett’s play Waiting for Godot, two tramps, Vladimir and Estragon, spend their time waiting for the titular character. He never arrives.
It feels like that with this recession. But according to my friend and colleague Jim Rickards, we’re already in one.
There’s compelling evidence that Jim’s correct.
But where’s the market crash we ordered? That looks like it’s never coming. And that’s a good thing.
In this edition of the Morning Reckoning, I’m going to argue in favor of Jim’s thesis that we’re in a recession, damn the GDP numbers.
I’ll also explain why the market hasn’t tanked yet. We have two of three ingredients for it, but the third one will prove elusive.
The Receding Economy
Are we, or aren’t we, in a recession? I’ll answer, “Yes, since March.” Here’s why.
Sahm, McKelvey, and Unemployment
Claudia Sahm, an old Fed economist, takes credit for a recession indicator she didn’t invent.
From Mish Shedlock:
Edward McKelvey, a senior economist at Goldman Sachs, created the indicator.
Take the current value of the 3-month unemployment rate average, subtract the 12-month low, and if the difference is 0.30 percentage point or more, then a recession has started.
Claudia Sahm, a former Federal Reserve and White House Economist, modified the indicator from 0.3 to 0.5.
Please consider The Sahm Rule: Step by Step, written December 7, 2023, by Claudia Sahm.
I created the Sahm rule, and it’s on me to communicate it well. I try. If you have any questions, please add them to the comments.
Sahm claims to have invented the rule. However, credit should go to Edward McKelvey, at Goldman Sachs.
The Lag Effect
Sahm modified the McKelvey rule to eliminate false positives. But that was at the expense of being far less timely.
In the 2008 recession, the Sahm rule triggered three months late. In the 1973 recession, Sahm triggered 7 months late.
Here’s the Sahm Rule Recession Indicator:
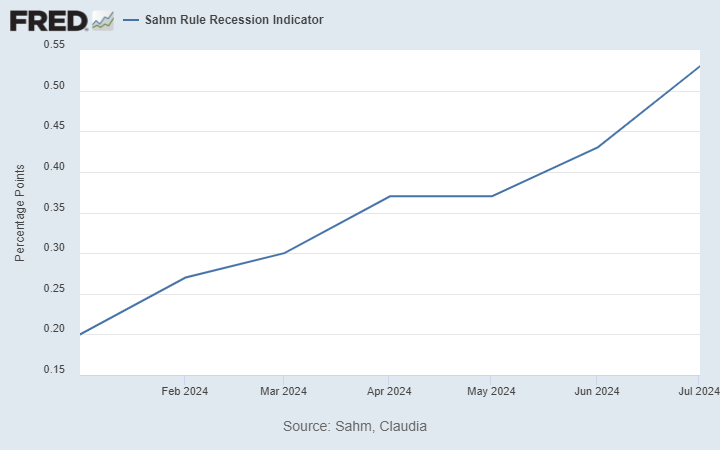
It hit McKelvey’s 0.30 threshold in March 2024 and has only climbed higher since. Right now, it’s above Sahm’s 0.50 threshold. Either way, the indicator says we’re in a recession.
The Market Crash That Isn’t Happening
Generally, we need three things to happen for the market to crash.
- Initial jobless claims are rising over time.
- The inverted yield curve (short rates > long rates) is steepening to normal (short rates < long rates).
- Oil prices are rising over time.
Only two of those three are happening right now.
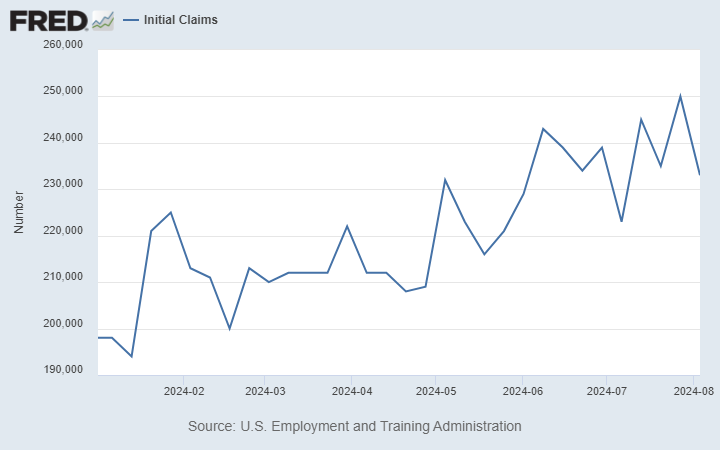
Initial Jobless Claims
Even though we had a respite last week, the numbers are trending up. An unemployed individual files an initial claimafter a separation from an employer. The claim requests a determination of basic eligibility for the Unemployment Insurance program. That means more people are losing their jobs and claiming unemployment insurance.
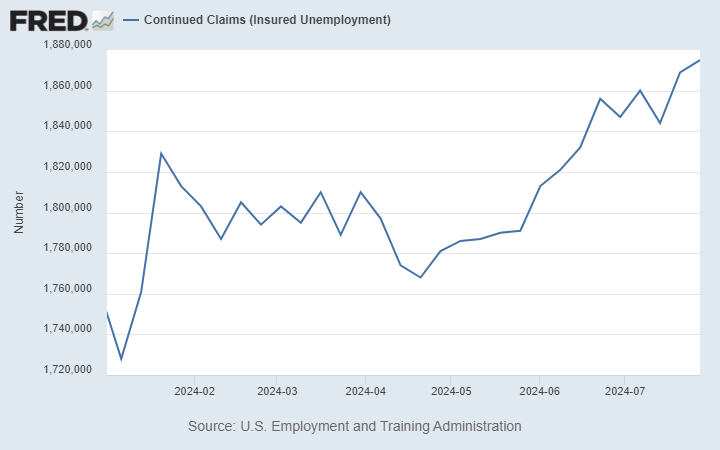
However, what compounds the issue is that continued claims are starting to increase after a sideways trend. Continued claims, also referred to as insured unemployment, are the number of people who have already filed an initial claim and have experienced a week of unemployment and then filed a continued claim to receive benefits for that week of unemployment.
Yield Curve Steepening (Un-inversion)
Most people start panicking when the yield curve inverts. Since that happened in late 2022, they’ve been biting their nails for nearly two years.
But the real danger of recession is when the curve steepens or “un-inverts” to become normal again. It’s normal for short-term interest rates to be lower than long-term interest rates. After all, if you were going to lend someone money for a decade, you’d demand a higher premium because of all the missed investment opportunities over that period. But you’d probably charge less if you loan money for a few months.
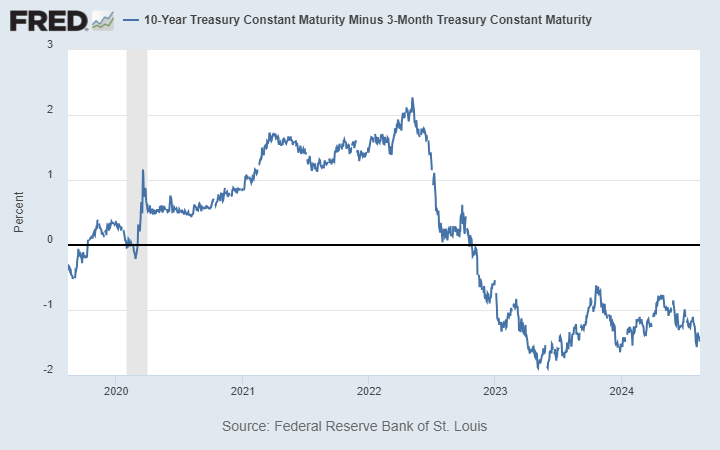
The yield curve often inverts when the Fed aggressively hikes short-term interest rates to combat inflation. We had this for most of 2022. The inversion reflects expectations that these high rates will slow economic growth.
When the curve begins to steepen, the Fed has either paused or is about to lower rates in response to weakening economic conditions, which is where we are in the cycle. The market sees this as a sign that the central bank is concerned about economic growth, reinforcing the recessionary outlook.
The steepening process signals a shift from the market expecting economic stagnation to actively preparing for a downturn, mainly as the economic data reflects weaker growth, declining consumer spending, and rising unemployment. Unemployment unexpectedly rose in the U.S. to 4.3% two Fridays ago.
Historically, recessions often follow a period when the yield curve first inverts and then steepens. The inversion signals economic stress, and the steepening tends to occur when that stress transitions into actual economic contraction, leading to a big market sell-off.
Oil Prices
Everything you’re wearing, eating, or sitting on was either made with or transported to you by oil. Never mind those green idiots; oil is the most important commodity on earth.
When oil gets expensive, we’ve got big problems. If we have increasing initial claims, a yield curve “un-inversion,” and an oil price rally, we will be smacked in the head with a market crash.
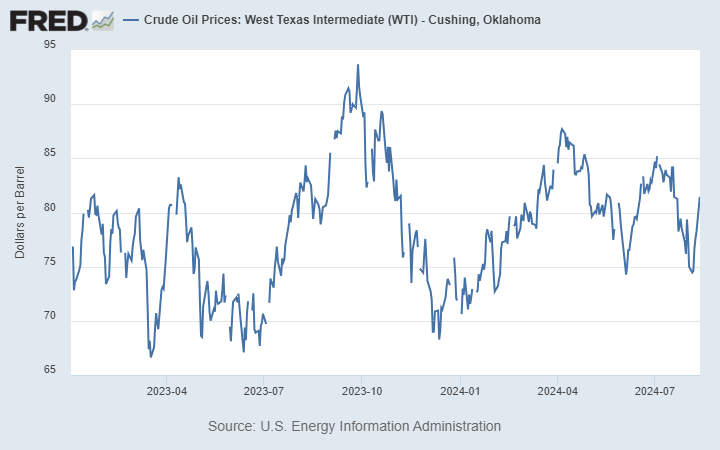
But here’s where the crash theory fails.
Despite the war in Ukraine, a war in Israel, saber-rattling over Taiwan, and the Houthis effectively closing the Suez Canal, oil prices are languishing.
We’ve been sitting around $80 forever. It’s a big yawnfest.
So, no market crash… for now.
Wrap Up
The recession has already begun. Most people can feel it. Some ignore it. Kamala Harris mustn’t acknowledge it. But if I were Trump, I’d be hammering her over it.
As for the market crash, it’s not imminent, and we may never get it. Unless and until oil prices start to rise, we should be reasonably fine in equities for the time being.


Comments: