

Time to Start Hedging
U.S. stocks today trade at valuations that rival prior peaks such as 1929 and 2000.
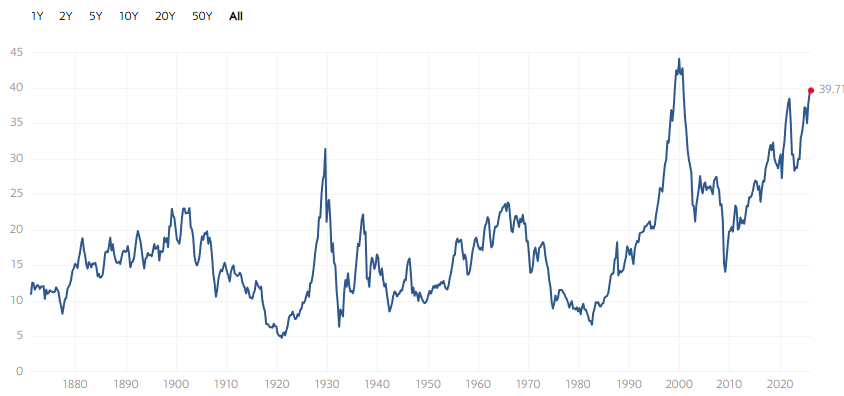
Take a look at the chart below, which shows the S&P 500 CAPE P/E (price-to-earnings) ratio.
Source: Multipl.com
The CAPE P/E ratio is one of the best measures of how expensive a stock or index is. It shows how pricey stocks are based on the last 10 years of earnings.
And it’s pretty good at identifying market peaks. Besides today, the two largest spikes in the chart are 1929 and 2000. Just before two of the largest stock market crashes in history.
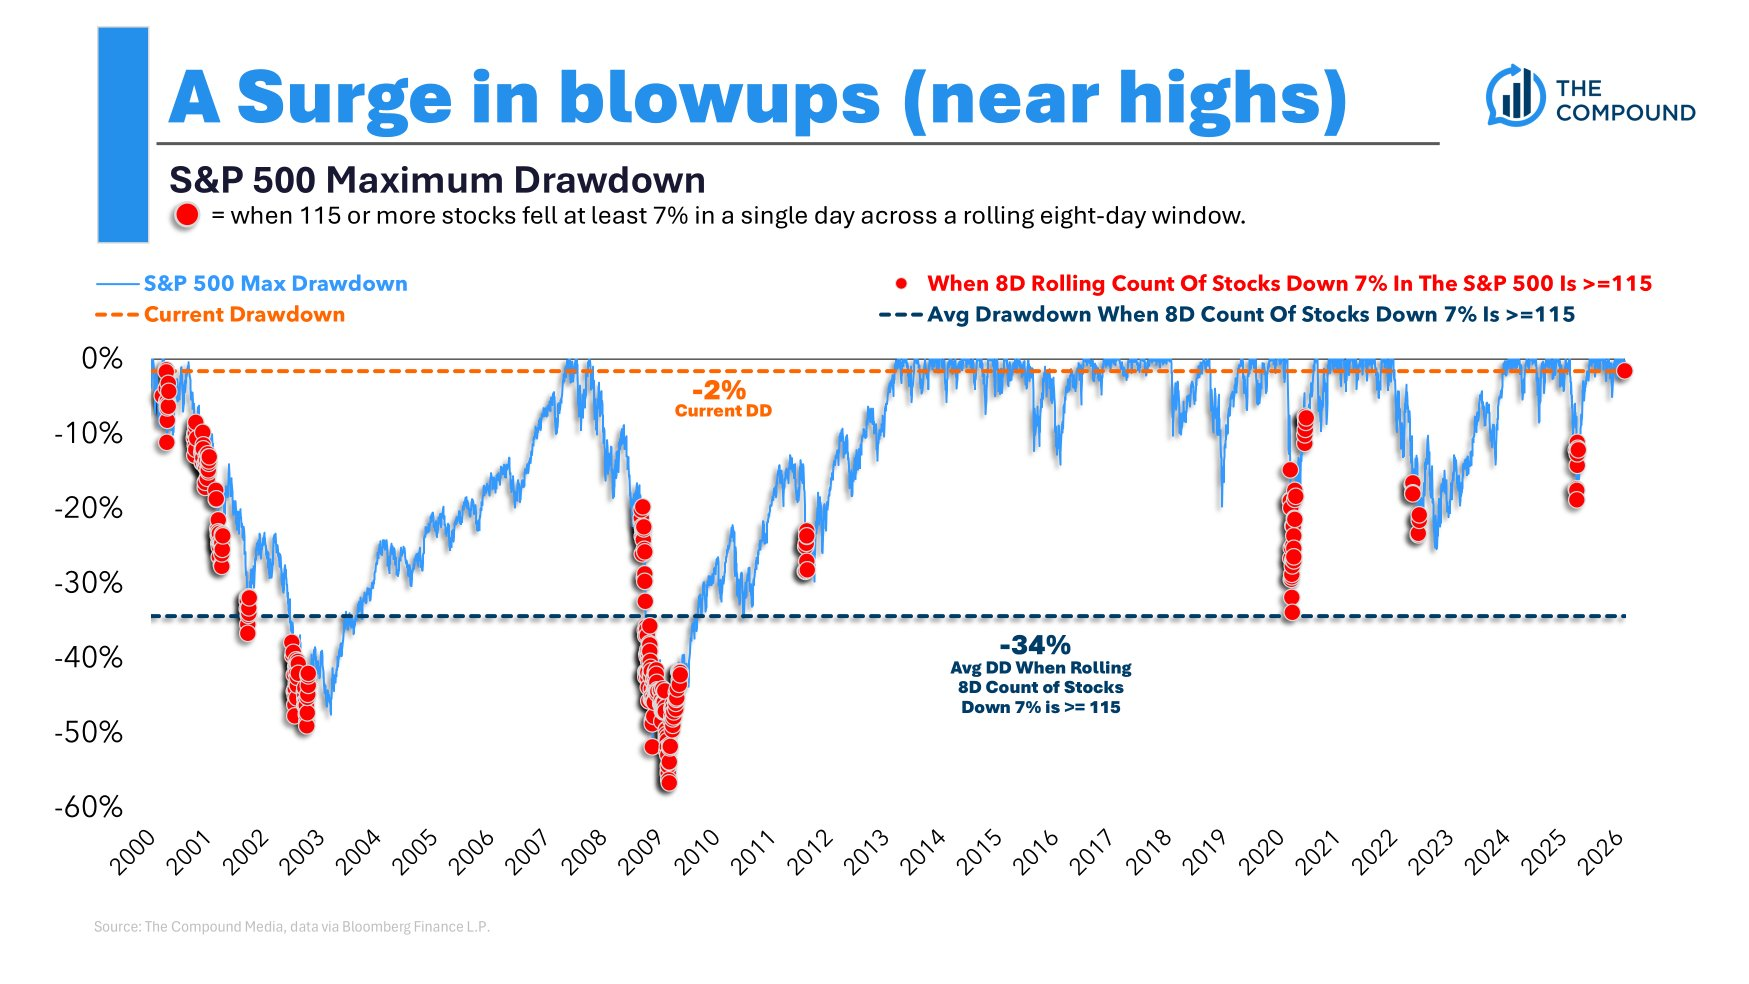
And the CAPE ratio isn’t the only flashing red warning. Take a look at the chart below. The red dots represent days when 115 of the S&P 500 stocks fell at least 7% in a single day across a rolling 8-day window.
Source: Michael Batnick
The overall market is still holding up well, but a large number of companies are getting smashed. And historically that’s a bad sign.
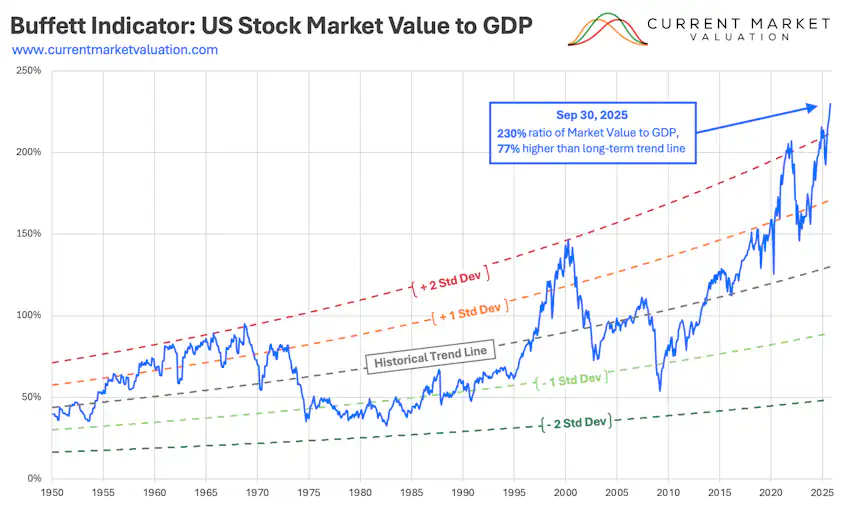
One more. It’s been a while since we looked at the Buffett Indicator. This is Warren Buffett’s favorite gauge for knowing when stocks are too expensive.
It shows the U.S. stock market value as a percentage of GDP.
Source: Current Market Valuation
Today, the total American stock market is worth around $70 billion. And U.S. GDP is $30 trillion. So the Buffett Indicator is at an unprecedented 230%. That’s way higher than even the dotcom bubble in 2000.
Prior to the bubble in the late 1990s, the Buffett Indicator never got above 100%. Now it’s 230%.
It is true that profit margins among U.S. stocks are high, and companies require less capital to operate than they used to. But we’re at unsustainable levels.
Another way to look at it is the current dividend yield. The S&P 500 only yields 1.15% today. That’s pitifully low.
Eventually, something’s got to give. Either companies need to magically start earning 2x more profits, or stocks need to fall sharply.
This is the primary reason we’ve been so focused on alternative investments like gold, silver, and emerging markets.
But at some point (maybe soon) it will make sense to buy downside protection. That means either put options or a short position on the Nasdaq or S&P 500. Just this week I dipped my toes into some puts on big tech companies. But it’s still a small hedge, for now.
Look, I’m not trying to be alarmist here. But there is real cause for concern.
Fortunately, when the time comes, we have a number of excellent short sellers here at Paradigm. Namely Jim Rickards, Dan Amoss, and Mason Sexton. Guys who can navigate the market successfully, no matter which way it’s moving.
Short selling has been tough sledding over the past few years, as stocks elevated to ridiculous levels. But shorting is one of those things where when it rains, it pours.
But please, don’t just go out and start shorting stuff that looks expensive. That can end poorly. If you’re going to hedge, a good way to approach it is to buy long-dated puts on a big index like the Nasdaq 100 or the S&P 500. In-the-money puts are a safer option.
It doesn’t take much exposure to hedge your portfolio’s downside, either. A few puts go a long way. So don’t overdo it. Even putting 0.5% of your portfolio in LEAP puts can offer significant protection.
I believe we’ve reached the stage where it’s time to start putting on a few hedges.
If a crash doesn’t happen, great. But if it does, having some protection already in place can make a huge difference.

Comments: