
Go Tell It On Bond Mountain
The bottom of the secular Treasury yield cycle (the secular top in Treasury prices) has long been the Loch Ness Monster of macroeconomics. Spotted many times over the last 10 years, the turn in the bond market is still more myth than reality. It could remain that way for years. Then two things will become painfully obvious: that the yield cycle has indeed bottomed out… and that the effects are devastating.
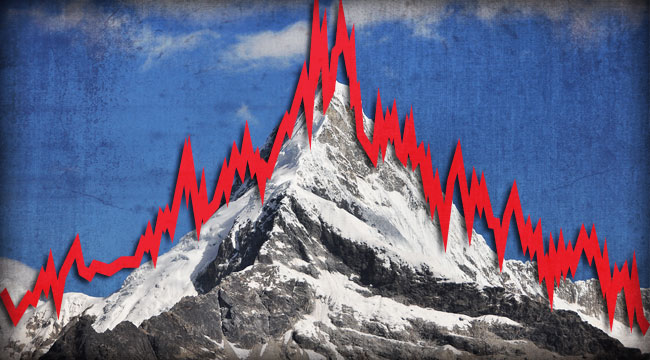
For family wealth investors, it doesn’t matter whether the top was reached (as we suspect) in early May 2013 or whether it will come five years from now. It will come when it is ready. As you can see from the chart, there is far more downside than upside in the bond market.

The risk of being wrong about the direction of the move is about even (bond prices are either going up or down). But the risk of losing money over, say, the next 30 years is far greater on the long side than the short side. After 32 years of rising prices… and yields so low you have to scrape them off the floor… speculating on the long side of the Treasury bond market seems unwise. Even reckless.
The chart of bond yields (above) gives rise to two insights — the first from intuition, the second from observation. Intuitively, the pattern is simple. The mountain has two sides. Yields went up. Then they went down by an equal amount. A round-trip. A full cycle. We can’t escape the instinct, confirmed by much of history, that the next major move for Treasury yields will be up. Whatever else we do, we should be prepared for it.
We can also observe, looking carefully at the left side of the chart, where the cycle began. You will notice that yields at the start of the period were about where they are now. You may be tempted to infer that the period ahead will be similar to the period between the 1950s and the 1980s, when we last saw a long climb in bond yields (and a fall in bond prices).
If we were to relive those years, few would complain. Those were glory years for the U.S., Europe and Japan (albeit with a later start). Rising yields did not hurt economic growth. They accompanied it. Perhaps they even aided it. Stocks rose. Bonds fell. Ozzie and Harriet raised their boys on rising, real incomes. All was well.
But before you settle into your seat, expecting to watch re-runs from the Eisenhower years, you should be aware that a lot has happened in the intervening years.
You may be thinking about Neil Armstrong walking on the moon, the Rolling Stones or the World Wide Web. But from our perspective, what is more important is the buildup of debt.
The falling bond yields (and rising prices) of the 1981-2013 period brought forth levels of credit such as the world had never before seen. Those credits now roll across the sky like dark clouds, obscuring the sun and threatening cold, nasty weather.
Compared with the amount of debt outstanding when the last bear market in bonds began — at the end of the 1940s — the amount today is catastrophically high. As the rubble from Dresden and Nagasaki was being cleaned up, accountants for the Federal Reserve put America’s total-debt-to-GDP ratio at 150%… most of it war debt. At the time, there was so little “financial debt” that the fellows with the green eyeshades might have forgotten to mention it. It totaled only 1.3% of GDP.
Today, total U.S. debt is about 350% of GDP. War debt doesn’t figure much; the U.S. has not had a serious war in more than 40 years. Still, public debt is about the same percentage of GDP as it was in 1946. What has really gone up is the financial debt — now nearly 90% of GDP. This financial debt is the footing on which our financial system now rests.
The “catastrophic” part is a guess about what happens when all that financial debt meets rising interest rates. “For every debit, there is a credit,” is the adobe brick upon which double-entry bookkeeping rests. It is also a dictum cited by people who tell you that rising debt service costs are nothing to worry about. But when the heavy rains begin, it all turns into mud.
When a person you owe money to wishes you good health, you can be sure he really means it. If you don’t pay him back, he will be out of pocket. But when he loses, you win. For accountants, it is even-steven. But when the bond market goes down, who wins? Pension funds will not be able to honor their commitments; who wins? Bond funds lose billions; who wins? The federal government pays higher rates of interest to finance its deficits; who wins? An entire society’s debt shoots up thanks to an unbacked paper dollar; who wins when this debt goes bad?
The capital structure of America and much of the rest of the world now rests on dodgy collateral — namely, U.S. Treasury bonds. When this debt gives way, there is no counterparty who gains. The whole thing melts down. Yes, there are occasional short sellers who do win. But compared with the losses, the wins are inconsequential.
You can imagine the situation as follows. A man in a small town has an auto dealership. He discovers that he can sell more cars by offering EZ credit terms — even to people with no obvious way of paying. His car sales go up. He expands. On the basis of his rising sales, he gets credit from all the merchants in town. One builds him a new house… and counts his mortgage as though it were as good as gold. Another gives him fuel… and plans a vacation on the value of the IOUs he accumulates. Others provide groceries, haircuts and insurance… all taking IOUs as though they were money in the bank.
When it is finally revealed that the new car buyers can’t pay, the debt edifice falls to the ground. In accounting terms, everything evens out. For every irredeemable IOU, the auto dealer gains an equal and opposite credit. But he is bankrupt. The credits are worthless. And everyone who took them in payment has lost money.
It is like the wipeout in subprime mortgage debt in 2007-2008. House prices went down. Debt was revealed to be worth considerably less than people thought. Those who held mortgages lost money. But the householders were still on the hook to pay!
When bond prices collapse, almost everyone loses wealth. And many apparently sound investments, based on the false premise of forever-low interest rates, collapse completely.
From 1946-1981, the world could tolerate… and prosper with… higher lending rates. Even Paul Volcker’s 20% target rate did not kill the boom. Instead, it saved it. But with so much more debt today, a return to even average interest rates could bring the whole structure tumbling down. Too much debt has rendered the economy “fragile,” as Nassim Taleb would say. Over the last 30 years, it has adapted to falling interest rates and rising credit. It now needs more of both to avoid falling apart.
Regards,
Bill Bonner
for The Daily Reckoning
Ed. Note: If you take a long enough view…the whether the bond bull market is intact or over doesn’t matter. But if you’re a saver you’re going to need all the help you can get. If you like Bill’s essay it’s only half the story. To get the full insights and solutions you need to save in a world of money printing gone wild sign up for the Daily Reckoning email edition here.

Comments: